Code
from lstchain.io.io import dl2_params_lstcam_keyfrom ctapipe.io import read_tableimport matplotlib.pyplot as pltimport numpy as npimport ctaplotimport astropy.units as ufrom astropy.visualization import quantity_supportfrom copy import deepcopyimport warnings"ignore" )'notebook' )
Code
# Reading DL2 parameters = 'dl2_gamma-diffuse_20deg_180deg_20220215_v0.9.1_prod5_trans_80_local_tailcut_8_4_testing.h5' = read_table(filename, path= dl2_params_lstcam_key)
Code
Table length=4
obs_id event_id intensity log_intensity x y r phi length length_uncertainty width width_uncertainty psi skewness kurtosis time_gradient intercept leakage_intensity_width_1 leakage_intensity_width_2 leakage_pixels_width_1 leakage_pixels_width_2 n_pixels concentration_cog concentration_core concentration_pixel n_islands alt_tel az_tel calibration_id mc_energy log_mc_energy mc_alt mc_az mc_core_x mc_core_y mc_h_first_int mc_type mc_az_tel mc_alt_tel mc_x_max mc_core_distance wl tel_id tel_pos_x tel_pos_y tel_pos_z trigger_type trigger_time event_type disp_dx disp_dy disp_norm disp_angle disp_sign src_x src_y log_reco_energy reco_energy reco_disp_norm reco_disp_sign reco_disp_dx reco_disp_dy reco_src_x reco_src_y signed_time_gradient signed_skewness reco_alt reco_az reco_type gammaness int32 int64 float64 float64 float64 float64 float64 float64 float64 float64 float64 float64 float64 float64 float64 float64 float64 float32 float32 float64 float64 int64 float64 float64 float64 int64 float32 float32 int64 float64 float64 float64 float64 float64 float64 float64 int64 float32 float32 float64 float64 float64 int64 float32 float32 float32 int64 float64 int64 float32 float32 float32 float32 float32 float32 float32 float64 float64 float64 float32 float64 float64 float64 float64 float64 float64 float64 float64 int64 float64 1001 709 204.69166946411133 2.311100168117379 -0.9429552882748465 -0.026957666936253902 0.9433405490554008 -3.1130119491933934 0.23443860343360137 0.007842269988100201 0.04986447721090286 0.002820204535803679 -0.4176405820038234 -0.07617936614500895 1.9161796601516858 3.1583494315627387 12.587750635123518 0.10073532 0.2327244 0.001078167115902965 0.0026954177897574125 17 0.23259960879032218 0.3863265920398024 0.12316187984675661 1 1.2217305 3.1415927 -1 0.10125340521335602 -0.9945903622811716 1.1737884283065796 3.155841827392578 117.61976623535156 -120.98987579345703 26547.115234375 0 3.1415927 1.2217305 290.8888854980469 200.7509994593757 0.21269738208889166 1 -70.93 -52.07 43.0 32 1606861253.334231 32 -0.3983867 0.18139814 0.43774107 -0.427279 -1.0 -1.341342 0.15444046 -1.1414124982346003 0.07220836338806491 0.46018360223014054 -1.0 -0.4206301199562092 0.18665275231598732 -1.3635854082310557 0.15969508537973343 3.1583494315627387 -0.07617936614500895 1.1729915791160523 3.1562981500860525 101 0.4760000000000001 1001 14702 217.4642243385315 2.337387820139739 0.46072834092859943 0.36336524399868014 0.5867750034562141 0.6677976333175436 0.11662511682514344 0.004811480715105807 0.053738868040224395 0.002788135479311323 -1.0265033637403687 -0.038384931699866426 2.4805392633587666 2.7483252979769865 12.349330838624663 0.0 0.0 0.0 0.0 12 0.5390022183986967 0.3993600665294417 0.2218359666299674 1 1.2217305 3.1415927 -1 0.0735081136226654 -1.1336647220440166 1.2285054922103882 3.2149901390075684 42.88823699951172 -197.08230590820312 18002.349609375 0 3.1415927 1.2217305 219.3333282470703 184.34521989047866 0.46078297285476955 1 -70.93 -52.07 43.0 32 1606861265.158689 32 -0.24724865 0.32590026 0.40907562 -0.92177355 -1.0 0.2134797 0.6892655 -1.2231808210053707 0.059816249481173096 0.30984948357431924 -1.0 -0.1604442004451036 0.2650742556620762 0.30028414048349583 0.6284394996607563 2.7483252979769865 -0.038384931699866426 1.2317426248864978 3.20911681028575 101 0.3741666666666666 1001 15008 165.50613975524902 2.218814109364702 -0.9169175343015934 -0.4088572589615097 1.0039432368989956 -2.722150123264711 0.07766195427204564 0.003358692847208187 0.06926784537908715 0.0031922758184949524 -1.47705421630234 0.5812040134885849 2.2382191567652474 -3.0261770559629255 12.396861472555743 0.12780459 0.5962281 0.0016172506738544475 0.0037735849056603774 10 0.5284481789086114 0.27380341851728035 0.25464478344000624 1 1.2217305 3.1415927 -1 0.06741833686828613 -1.171221965221083 1.1863691806793213 3.123426675796509 0.5827245712280273 -149.97592163085938 21047.283203125 0 3.1415927 1.2217305 188.18182373046875 121.24206930514356 0.8919147866978162 1 -70.93 -52.07 43.0 32 1606861266.308928 32 -0.07156822 0.21798934 0.22943705 -1.253573 -1.0 -0.98848575 -0.19086792 -1.169116370207806 0.06774599563308585 0.21682144939570283 -1.0 -0.02029554496514809 0.21586947855734717 -0.9372130792667415 -0.19298778040416253 -3.0261770559629255 0.5812040134885849 1.1881988117550633 3.123140245988693 101 0.0455 1001 24006 5026.379844665527 3.7012553052292714 -0.46367241536546555 -0.08235761000760355 0.4709298086732346 -2.965805734618248 0.32224864071559073 0.0035545823049572705 0.07874576241532436 0.0012247855781627778 -0.04766358667702001 -0.8975937266162266 3.446251471675243 -3.3362477070804664 15.747667526377434 0.0 0.0 0.0 0.0 64 0.18626662829024138 0.44953505412944617 0.09333687274463297 2 1.2217305 3.1415927 -1 1.0042767524719238 0.001853409531100706 1.2219613790512085 3.1297266483306885 -205.5702667236328 -40.51348114013672 24701.7890625 0 3.1415927 1.2217305 335.6097412109375 135.1353190780927 0.24436336563114805 1 -70.93 -52.07 43.0 32 1606861279.03483 32 0.4707722 -0.031204343 0.47180524 -0.066186495 1.0 0.0070998 -0.11356195 -0.018787232399360337 0.9576631304024323 0.4663458548076254 1.0 0.46581622875101053 -0.022219300809005443 0.0021438133855449792 -0.104576910816609 3.3362477070804664 0.8975937266162266 1.221787863315046 3.130670740376984 0 0.96
Code
def add_params(events):""" add some parameters and units """ for pos in ['reco_src_x' , 'reco_src_y' , 'src_x' , 'src_y' , 'reco_disp_dx' , 'reco_disp_dy' , 'x' , 'y' ]:= u.mfor ang in ['reco_alt' , 'reco_az' , 'mc_alt' , 'mc_az' , 'alt_tel' , 'az_tel' ]:= u.radfor ene in ['reco_energy' , 'mc_energy' ]:= u.TeV'diff_x' ] = events['reco_src_x' ] - events['src_x' ]'diff_y' ] = events['reco_src_y' ] - events['src_y' ]'diff_alt' ] = events['reco_alt' ] - events['mc_alt' ]'diff_az' ] = events['reco_az' ] - events['mc_az' ]'diff' ] = np.sqrt(events['diff_x' ]** 2 + events['diff_y' ]** 2 )'offset' ] = ctaplot.ana.ana.angular_separation_altaz(events['alt_tel' ].quantity, events['az_tel' ].quantity,'mc_alt' ].quantity, events['mc_az' ].quantity)'alpha' ] = np.arctan2(events['src_y' ], events['src_x' ])
Code
def plot_true_pos(events, ax= None ):= plt.gca() if ax is None else ax'src_x' ], events['src_y' ], s= 1 ); True )'equal' )'src_x' )'src_y' )'events position' )return ax;
Code
def plot_psf(events, ax= None ):= plt.gca() if ax is None else ax= 1.6 = 0.4 # ax.hist2d(events['diff_x'], events['diff_y'], bins=100, range=[[-r,r],[-r,r]]); = events['reco_az' ] - events['mc_az' ]= events['reco_alt' ] - events['mc_alt' ]with quantity_support():= 120 , range = [[- rx,rx],[- ry,ry]], cmap= 'hot' )True )# ax.axis('equal') 'diff_az [rad]' )'diff_alt [rad]' )'PSF' )return ax;
Code
def plot_theta2(events, ax= None , bias_correction= True ):= plt.gca() if ax is None else ax= dict (bins= 100 , range = (0 , 0.05 ), density= True , histtype= 'step' , bias_correction= False , lw= 2 )= ctaplot.plots.plot_theta2(events['mc_alt' ].quantity, 'reco_alt' ].quantity, 'mc_az' ].quantity, 'reco_az' ].quantity,= ax, = 'no bias correction' ,** opt)if bias_correction:'bias_correction' ] = True = ctaplot.plots.plot_theta2(events['mc_alt' ].quantity,'reco_alt' ].quantity,'mc_az' ].quantity,'reco_az' ].quantity,= ax, label= 'bias corrected' , ** opt)return ax= True );
Code
def plot_bias_per_offset(events, ax= None , ** kwargs):= ctaplot.ana.bias_per_bin(events['mc_alt' ], events['reco_alt' ], events['offset' ], bins= 20 )= ctaplot.ana.bias_per_bin(events['mc_az' ], events['reco_az' ], events['offset' ], bins= 20 )= plt.gca() if ax is None else ax= np.rad2deg(offset), label= 'bias in alt' , ** kwargs)= np.rad2deg(offset), label= 'bias in az' , ** kwargs)'offset in degrees' )'bias in degrees' )return axdef plot_bias_per_alpha(events, ax= None , ** kwargs):= ctaplot.ana.bias_per_bin(events['mc_alt' ], events['reco_alt' ], events['alpha' ], bins= 20 )= ctaplot.ana.bias_per_bin(events['mc_az' ], events['reco_az' ], events['alpha' ], bins= 20 )= plt.gca() if ax is None else ax= np.rad2deg(alpha), label= 'bias in alt' , ** kwargs)= np.rad2deg(alpha), label= 'bias in az' , ** kwargs)'alpha in degrees' )'bias in degrees' )return ax; ;
Code
# Select bright events to see the effect = params[(params['intensity' ]> 500 )]# selected_events = bright_events[(bright_events['src_x']>0) & (bright_events['src_y']>0)] = bright_events[(- np.pi/ 4 < bright_events['alpha' ])& (bright_events['alpha' ]< np.pi/ 4. )]
Code
def plot_all(events):= plt.subplots(1 , 5 , figsize= (25 ,5 ))= axes[0 ])= axes[1 ])= axes[2 ])= axes[3 ])= axes[4 ])
Code
print ("Bright events" )
Bright events in quarters
Code
= np.histogram_bin_edges(bright_events['alpha' ].value, bins= 5 )for ii, low in enumerate (edges[:- 1 ]):= bright_events[(low< bright_events['alpha' ])& (bright_events['alpha' ]< edges[ii+ 1 ])]
Correcting the bias
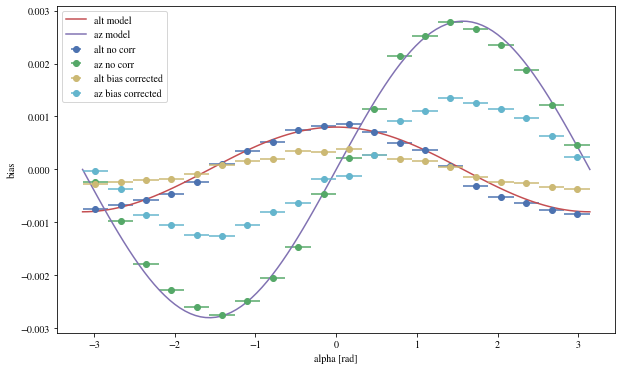
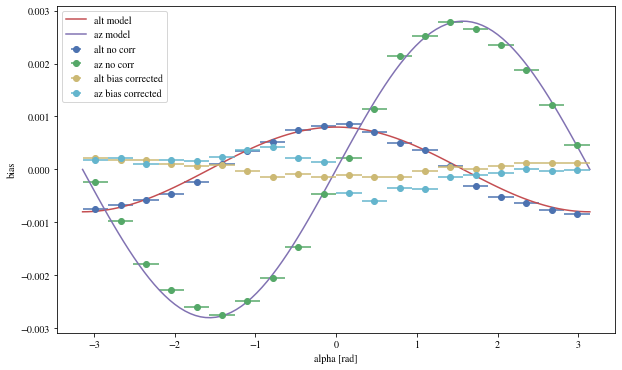
We can reconstruct the source position in the sky with a different focal length. To visualize the bias, we can plot it as a function of alpha, the angle between the event position and the X-axis
Code
from lstchain.reco.utils import reco_source_position_sky
Code
def patch_events(events, true_focal_length= 29.04 * u.m, plot= True ):= reco_source_position_sky(events['x' ], events['y' ],'reco_disp_dx' ], events['reco_disp_dy' ],'alt_tel' ], 'az_tel' ])= deepcopy(events)'reco_alt' ] = raltaz.alt.to(u.rad)'reco_az' ] = raltaz.az.to(u.rad)if plot:= (10 ,6 ))= dict (bins= 20 )'mc_alt' ], 'reco_alt' ],'alpha' ],** opt,= 'alt no corr' 'mc_az' ], 'reco_az' ],'alpha' ],** opt,= 'az no corr' = np.linspace(- np.pi, np.pi, 100 )* 0.0008 , label= 'alt model' )* 0.0028 = 'az model' )'mc_alt' ], 'reco_alt' ],'alpha' ],** opt,= 'alt bias corrected' ,'mc_az' ], 'reco_az' ],'alpha' ],** opt,= 'az bias corrected' ,'alpha [rad]' )return events_corr
Code
= patch_events(bright_events);
We can see that a bias is still present.
Code
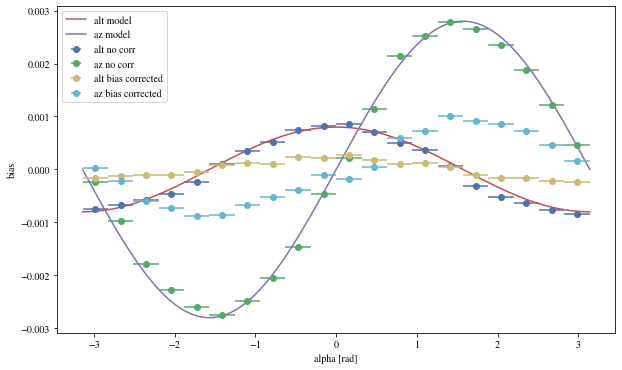
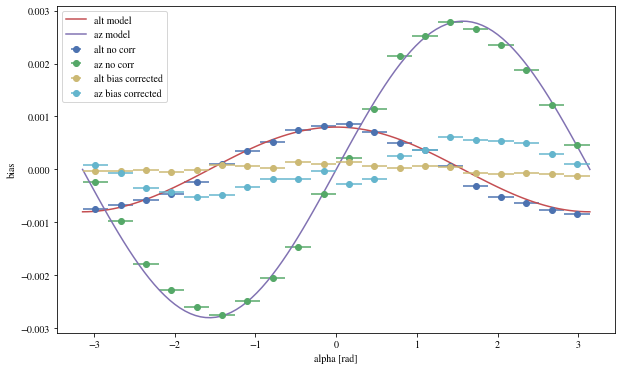
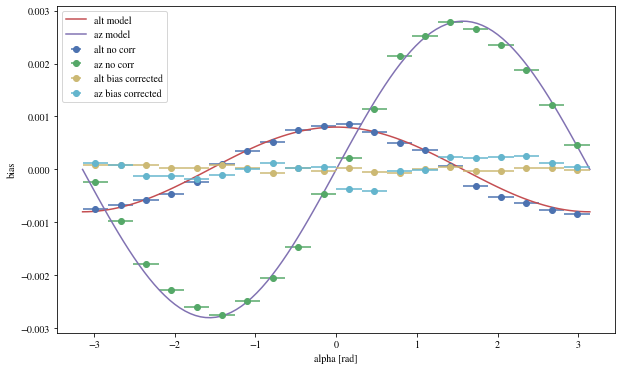
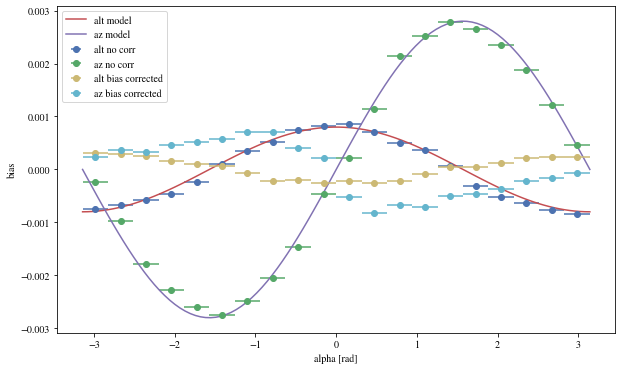
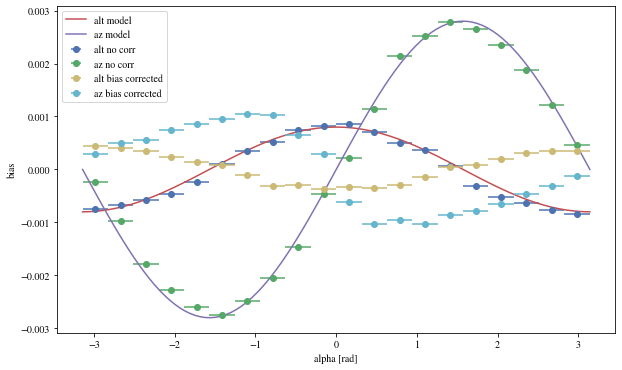
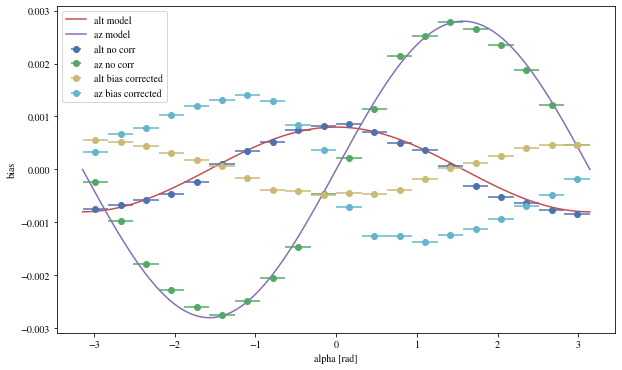
= np.linspace(28.2 , 29.2 , num= 10 ) * u.m= []= [] for fl in focal_lengths:print (fl)= patch_events(bright_events, true_focal_length= fl); = ctaplot.ana.bias_per_bin(pe['mc_alt' ], pe['reco_alt' ], pe['alpha' ])abs (bias))))= ctaplot.ana.bias_per_bin(pe['mc_az' ], pe['reco_az' ], pe['alpha' ])abs (bias))))
28.2 m
28.31111111111111 m
28.42222222222222 m
28.53333333333333 m
28.644444444444442 m
28.755555555555556 m
28.866666666666667 m
28.977777777777778 m
29.08888888888889 m
29.2 m
We can find the effective focal length that minimize the bias:
Code
= 'alt' )= 'az' )'Minimizing the bias' )'effective focal length [m]' )'bias [degrees]' )assert np.argmin(bias_alt) == np.argmin(bias_az)print (f"The focal length that minimize the bias: { focal_lengths[np.argmin(bias_alt)]:.3f} " )
The focal length that minimize the bias: 28.756 m
Let’s see the results with that focal length:
Code
= patch_events(bright_events, focal_lengths[np.argmin(bias_alt)], plot= False );
Code
= np.histogram_bin_edges(params_patched['alpha' ].value, bins= 5 )for ii, low in enumerate (edges[:- 1 ]):= params_patched[(low< bright_events['alpha' ])& (params_patched['alpha' ]< edges[ii+ 1 ])]
The alpha-dependence is now gone
Angular resolution before and after
Code
= params[(params['intensity' ]> 100 ) & (params['gammaness' ]> 0.4 )]= patch_events(selected_events, plot= False )
Code
'mc_alt' ].quantity,'reco_alt' ].quantity,'mc_az' ].quantity,'reco_az' ].quantity,'reco_energy' ].quantity,)'mc_alt' ].quantity,'reco_alt' ].quantity,'mc_az' ].quantity,'reco_az' ].quantity,'reco_energy' ].quantity,)'north' , color= 'black' )0 , 0.4 )
Testing the same correction on point source gammas
Code
= 'dl2_gamma_20deg_180deg_off0.4deg_20220215_v0.9.1_prod5_trans_80_local_tailcut_8_4_testing.h5' def analyis(filename):= read_table(filename, path= dl2_params_lstcam_key)# bright_events = params[(params['intensity']>5000)] = params[(params['intensity' ]> 50 ) & ((params['gammaness' ]> 0.7 ))]= patch_events(bright_events, true_focal_length= 29.04 * u.m, plot= False )= plt.subplots(1 , 3 , figsize= (20 ,5 ))= axes[0 ])= dict (bins= 50 , histtype= 'step' , range = (0 , 0.1 ))'mc_alt' ].quantity,'reco_alt' ].quantity,'mc_az' ].quantity,'reco_az' ].quantity,= axes[1 ],= 'no bias correction' ,** opt'mc_alt' ].quantity,'reco_alt' ].quantity,'mc_az' ].quantity,'reco_az' ].quantity,= axes[1 ],= 'bias corrected' ,** opt1 ].legend()'mc_alt' ].quantity,'reco_alt' ].quantity,'mc_az' ].quantity,'reco_az' ].quantity,'reco_energy' ].quantity,= axes[- 1 ],= 'no bias correction' , 'mc_alt' ].quantity,'reco_alt' ].quantity,'mc_az' ].quantity,'reco_az' ].quantity,'reco_energy' ].quantity,= axes[- 1 ],= 'bias corrected' ,# ls='--' 'north' , color= 'black' , ax= axes[- 1 ])- 1 ].set_ylim(0 , 0.4 )


